An example of a basal temperature chart. How to properly conduct basal thermometry. Hormonal deficiency: estrogens
So, you have built your first graphs and even before visiting gynecologist want to know if there are any deviations in the graphs. In classic guides to gynecology Five main types of temperature curves are described. For clarity, each type is accompanied by an example of a graph that most closely matches the described type.
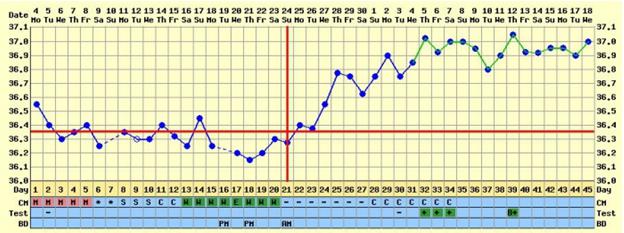
Such graphs indicate an increase in temperature in the second phase of the cycle by at least 0.4 C; a noticeable “preovulatory” and “premenstrual” drop in temperature. The duration of the temperature increase after ovulation is 12-14 days. This curve is typical for a normal two-phase menstrual cycle. Example:

This graph shows a pre-ovulatory drop on the 12th day of the cycle (the temperature drops significantly two days before ovulation), as well as a premenstrual drop starting on the 25th day of the cycle.
There is a slight rise in temperature in the second phase. The temperature difference in the first and second phases is no more than 0.2-0.3 C. Such a curve may indicate estrogen-progesterone deficiency. Example:

IN gynecology it is believed that if such graphs are repeated from cycle to cycle, then this may indicate hormonal imbalances that are the cause infertility.
Basal temperature begins to rise only shortly before menstruation, and there is no “premenstrual” drop in temperature. The second phase of the cycle lasts less than 10 days. This curve is typical for a two-phase menstrual cycle with insufficiency of the second phase. Example:

Pregnancy in such a cycle is possible, but it is under threat from the very beginning. At this moment, the woman cannot yet know about the pregnancy, even gynecologists It would be difficult to make a diagnosis at such an early stage. With such a schedule, we may not be talking about infertility, but about miscarriage. Be sure to contact gynecologist, if such a schedule repeats for you for 3 cycles.
A monotonous curve occurs when there is no pronounced rise throughout the entire cycle. This schedule is observed during an anovulatory (no ovulation) cycle. Example:

On average, a woman has one anovulatory cycle per year and there is no reason to worry in this case. But anovulatory schedules that are repeated from cycle to cycle are a very serious reason to turn to gynecologist. Without ovulation, a woman cannot become pregnant and we are talking about female infertility.
Chaotic temperature curve. The graph shows large temperature ranges; it does not fit into any of the types described above. This type of curve can be observed both with severe estrogen deficiency and depend on random factors. Example:

The gynecologist draws conclusions!
Regardless of what type of chart you have, do not make diagnoses based on your charts and avoid doctors who do not order additional tests if your charts show problems. A competent gynecologist will definitely require hormone tests and conduct an ultrasound examination before prescribing medications.
It is useful for every girl who is planning a pregnancy to know how to keep a basal temperature (BT) chart. This is not difficult, but the process requires a lot of patience, because you will have to mark your BT every day for at least two to three months. It is better to analyze the resulting graphs together with a gynecologist. However, using this method, even without a doctor, you can learn a lot about your health and ability to conceive. Our article, written together with an obstetrician-gynecologist, will help you with this.
Basal temperature and body temperature are not the same thing. BT is measured not in the armpit, but in the vagina, mouth or (most often) in the anus. This is not the temperature of the surface of the body, but the temperature of the internal organs. Basal temperature changes noticeably even with slight changes in the level of some female hormones.
Body temperature depends little on the day of the monthly cycle, but BT changes noticeably when changing phases of the cycle. That is why obstetricians-gynecologists and women themselves have been drawing up BT charts for several decades to find out how the reproductive system works.
The method was invented in the 50s of the 20th century in Great Britain. Professor Marshall discovered that the hormone progesterone (one of the main hormones of the female reproductive system) can significantly influence the temperature of the female body. Basal temperature can be used to accurately determine fluctuations in hormone levels. And since the amount of progesterone changes throughout the cycle, using the BT schedule you can understand at home how the ovaries work.
BT will even help tell you whether conception has occurred. Of course, you will receive a clear answer to this question only after a delay with the help of special tests or analyses. But the chart will tell you that pregnancy is not excluded.
However, you should not think that a “thermometer in the butt” is a mandatory part of the program for all women who want to get pregnant. Not at all. When planning a pregnancy, measuring your basal temperature is completely optional. It is much more important to undergo at least a minimal medical examination by a gynecologist and therapist - tests for infections, levels of major sex hormones, a general blood test, etc.
But there are situations when the method of measuring basal temperature will be really useful:
- If you fail to get pregnant within 6-12 months. If the “experience” is less, there is absolutely nothing to worry about yet. You just have to keep trying. If it is more, we can already talk about infertility, and you need to undergo a serious examination by a doctor. But in this time period, the chart will help you navigate when ovulation occurs (and specifically “work” on a future pregnancy on these days). BT will also help you make sure that your reproductive system is working correctly.
- If your doctor recommended that you measure your BT. This method is not the main one in diagnosis, but as an auxiliary method it has been used for a long time and successfully. For example, it will help your doctor figure out whether your dominant follicle is maturing and whether you are ovulating. However, as a rule, the doctor asks the patient to supplement the BBT measurement with ovulation tests. And keep in mind that no doctor has the right to make a diagnosis and prescribe treatment only on the basis of BT charts! This is an additional research method, but nothing more;
- If you are in a hurry to get pregnant and want to know exactly when your fertile days are.
Should I trust this method?
Let’s make a reservation right away: many modern doctors consider this method outdated. Just 10 years ago, scheduling BT was a mandatory part of the examination of patients who had difficulty conceiving.
Now a number of doctors have abandoned this study in favor of other - more accurate and less painstaking - methods. For example, (special ultrasound) and ovulation tests.
Indeed, in some situations the BT chart will be inaccurate and may be misleading:
- If you measure the temperature incorrectly;
- If you measure BT for only one month. The only graph is uninformative. It is necessary to carry out measurements at least three cycles in a row;
- If you have a chronic or acute disease (not necessarily related to gynecology);
- if you have hypo- or hyperthyroidism (thyroid disease);
- You are taking sedatives or hormonal medications
and in some other situations.
However, if done correctly, BT can still serve as a free but valuable diagnostic tool.
Of course, you yourself should not make any diagnoses or take medications based on the BT schedule. This is an inaccurate method, and self-medication is unacceptable!
How to measure basal temperature correctly
There are three main ways to measure basal temperature:
- in the mouth (orally);
- in the vagina (vaginally);
- in the anus (rectally).
Each of them has its pros and cons, while the third method is considered the classic and most accurate. Refrain from experiments: if you start measuring in your mouth, continue until the end of the cycle. In the next cycle, if the measurement method seems inconvenient, it can be changed.
You can measure basal temperature with either a regular (mercury) thermometer or an electronic thermometer, but it must be of high quality and accurate. After all, if you have, for example, a sore throat, then it doesn’t really matter what your temperature is - 38.6 or 38.9. But when measuring BT, every tenth of a degree carries a lot of meaning. The mercury thermometer is held for 6-7 minutes, the electronic one - until the signal is given, plus 2-3 minutes, this will be more accurate. You should not change the thermometer during one cycle. For hygiene reasons, the thermometer should be wiped with alcohol after measurement.
BT is measured early in the morning immediately after waking up, without getting out of bed and without even moving (the thermometer must be shaken off in advance and placed on the nightstand next to the bed, but not under the pillow). It is important that you get at least three hours of uninterrupted sleep (without going to the toilet or getting water) before waking up.
The main rule for measuring basal temperature is to keep the thermometer in a lying position, in a relaxed state, almost half asleep, without moving. Write down the result (graph) immediately - it’s easy to forget.
If you couldn’t measure it in the morning, there’s no point in doing it in the afternoon. After all, during the day the basal temperature is unstable, it jumps depending on the emotional state, physical activity, food, etc.
Why does the schedule go wrong?
Some conditions can affect your basal temperature and make the chart unreliable. Continue measuring BT, but note those days when the following circumstances were in effect:
- ARVI or other viral and bacterial diseases with fever;
- taking certain medications, such as hormonal or sedatives. When taking oral contraceptives, ovulation is suppressed, so measuring BBT is generally pointless;
- injuries, surgical interventions, including minor ones (for example, you had a tooth pulled out);
- stress, insomnia;
- drinking alcohol;
- indigestion;
- moving, flying, especially with a change in time zones;
- sexual intercourse
When analyzing the graph, you need to make adjustments for these factors.
How to build a graph
To plot your basal temperature chart, click on this template and save it to your computer (and fill it out right there) or print it.

Click to enlarge the template. Download it to your computer and fill it out right there. Or print and fill out by hand.
The numbers in the top column are the days of the menstrual cycle (not to be confused with the days of the month). Every day after measuring your temperature, put a dot in the appropriate box. To create a graph, at the end of the cycle, connect the points sequentially with a line.
After the graph is completed, you need to draw a closing line. To do this, you need to look at the temperature values on days 6 to 12. A line is drawn above them. This line is a service line, it is needed only for clarity.
Below, in the empty field, you can make notes. For example, “from 12 to 15 dc - a tooth hurt, the temperature rose.” “Day 18 of the cycle is very stressful.”
What should be a normal basal temperature?
Normally, basal temperature changes throughout the entire cycle, and the graph turns out to be two-phase.
The duration of the cycle and the length of each phase are different for each woman, so we give approximate, indicative figures.
During menstruation, BT is usually 36.7-37 degrees. When the bleeding stops, the temperature drops slightly. In the first phase of the monthly cycle (from 1 to 10-15 days), a woman has high levels of estrogen and low levels of progesterone. Immediately after menstruation, the normal basal temperature is low. In a healthy woman it rarely rises above 36.6.
Before ovulation it may decrease slightly. And after ovulation it rises to 37 and above. The difference between the phases is 0.4-0.8 degrees.
Normally, basal temperature may drop slightly before your period. If this does not happen, this may indicate both individual characteristics and a possible pregnancy.
Here is an example of a basal temperature chart.

If your graph is similar to the one in the picture, then most likely you are ovulating and your ovaries are working correctly. If there are deviations, if there is no clear rise in temperature in the second phase of the cycle, this may indicate (although not necessarily) some hormonal problems.
How to determine ovulation on a schedule
By how the basal temperature changes, you can calculate ovulation - that important moment when the egg is released from the ovary and fertilization is possible. A normal basal temperature chart involves fairly sharp fluctuations. Before ovulation, BT decreases slightly, and then, during ovulation, it rises quite sharply. On the graph, at least three points in a row must be above the covering line. The ovulation line is drawn vertically - it separates low temperatures from high ones.
If, for example, BT was 36.5, and then the basal temperature was 37, then this means that ovulation occurred. If you are planning to conceive, you should have sex two days before, during, and two days after ovulation.
But keep in mind that you should not use this information as a method of contraception. The “dangerous days” method is extremely unreliable. It gives a high percentage of spontaneous pregnancies. If you use contraception only on “dangerous days,” be prepared for the fact that you will become pregnant within a year with a probability of 10-40 percent (this variation is due to the fact that the risk was analyzed using different methods).
The unreliability of the “dangerous days” method is due to the fact that viable sperm can “survive” in the female genital tract for several days. And wait for the ovulated egg. In addition, the method of measuring basal temperature cannot determine ovulation with one hundred percent accuracy.
BT for various pathologies
Basal temperature can tell you whether a woman is healthy and even help with making a specific diagnosis.
We publish examples of basal temperature charts with explanations.
Anovulatory cycle
If the graph is monotonous, if there is no rise in temperature in the second phase, we can talk about the absence of ovulation and that this cycle and. That is, the dominant follicle does not mature or matures, but for some reason does not burst. Accordingly, a mature egg is not released, and conception cannot occur in this cycle. Normally, each woman has from 2 to 6 anovulatory cycles per year (the older the woman, the more there are). But if such a picture is observed for several months in a row, this may be a source of problems with conception. We need to see a doctor.

Estrogen-progesterone deficiency
If there is a rise in temperature, but it is small (01-0.3 degrees), this may indicate a deficiency in the corpus luteum phase (estrogen-progesterone deficiency). In this situation, ovulation occurs, fertilization may even occur, but the level of hormones is insufficient to support pregnancy. This condition is corrected with hormonal medications (they must be prescribed by a doctor).

Short second phase
(after ovulation) is normally 12-16 days. If it is shorter than 10 days, this may indicate a failure of the second phase. A ovulated egg, even if fertilized, will not be able to penetrate the endometrium, and pregnancy will not occur. In this case, deciphering the basal temperature chart will not be difficult: pregnancy is problematic. See your doctor.

The duration of the first phase is not so important: it depends on the individual characteristics of the woman and has little effect on the ability to conceive.
Estrogen deficiency
If BT is high in the first phase (36.7-37 degrees), this may mean that you lack estrogen - important female hormones. If this condition is confirmed by tests, then it needs to be corrected with special medications.

Inflammation
Also, high temperature in the first phase can be triggered by inflammation of the appendages or other gynecological inflammatory diseases.

Signs of an inflammatory disease
Attention: these graphs can only suggest problems! This is not a diagnosis or a reason to take medication.
What abnormalities should you report to your doctor?
monotonous graphs, when the temperature is higher or lower than 37 throughout the entire cycle, with temperature differences being less than 0.4 degrees;
- too short monthly cycle (21 days or less);
- the monthly cycle is too long (more than 36 days);
- if there is no clear ovulation on the chart, and this picture is observed for several cycles in a row;
- if sharp, unsystematic jumps in BT are observed during the cycle. However, this condition can be explained by various external and internal factors that affect temperature (alcohol intake, stress, somatic diseases, etc.);
- if the schedule is normal, but the desired pregnancy does not occur within 12 months.
BT during pregnancy
If at the very end of the cycle the temperature does not decrease, but remains high (37 degrees or above), there is a chance that you are pregnant. Normally, it will remain at a level of 37-37.5 throughout the first trimester. A sharp decrease may be random, or may mean complications during pregnancy. There is no need to panic, but it is better to contact your gynecologist.

A graph based on temperature measurements helps girls identify the day of ovulation. In addition, with its help you can promptly notice deviations and suspect some kind of disease. Let's look at what a typical basal temperature chart is with examples and interpretation for a normal cycle, when pregnancy is detected, and in some pathologies.
Rules for measuring basal temperature
Many girls, when drawing up a basal temperature chart, make comparisons with examples on forums, which is not always correct, because everyone’s body is individual. In addition, you need to remember that the temperature is influenced by many factors, and therefore the lines are different for everyone and contain atypical “jumps” and dips.
Therefore, first of all, you need to study the rules for taking measurements so that the result is reliable:
- Use one thermometer. Do not alternate electronic with mercury.
- Take measurements first thing after waking up. You need to prepare everything in the evening (thermometer, a piece of paper for writing) so as not to even get out of bed. Do not make sudden movements, maintaining a calm state as much as possible.
- The testing time should be the same every day.
- Avoid heavy physical activity, taking hormonal medications, drinking alcohol while planning pregnancy, try not to be nervous, because All these factors affect the temperature and can distort the graph.
- You need to conduct observations for several months to identify your standards and learn to decipher them.
As we have already mentioned, temperature is affected by various deviations from the normal rhythm of life, illness, stressful situations, flights, climate change, etc. Therefore, in the schedule you need to make notes about the presence of some situation on a specific day. This will allow you to exclude irrelevant indicators during decryption. By the way, sexual intercourse can also change the temperature. After it, the body returns to normal only after 10-12 hours.

Basal temperature chart with examples and explanation
Normal schedule with two phases
Considering a typical, normal basal temperature graph and an example of constructing a curve, the following points should be noted:
- The first few values taken during menstruation do not play a special role.
- It is necessary to draw a line that will be the average of the first stage. Normally, about 6 days should have the same values (a deviation of 0.1°C is considered normal). If there is a “leap”, but there is an explanation for it, this day is simply not taken into account.
- On the eve of ovulation, there is a drop from the average value by 0.2-0.4°C. This lasts 1-2 days.
- The moment the egg appears is marked by a sharp increase in temperature - by 0.4-0.6°C. Before this jump, you can draw a vertical line that indicates ovulation.
- After ovulation, there is a slow increase in temperature or a constant stay at elevated values.
- 3-5 days before menstruation there is a decline - 0.1°C daily or more sharp - 0.2°C in two days, for example.

Anovulatory schedule
Every girl can have a cycle without egg maturation. It's normal if it happens once a year. In case of more frequent or constant absence of an egg, you need to consult a doctor and identify the cause of the pathology in order to prevent infertility.
On the graph, the anovulatory period is characterized by the following features:
- There are no drops in the middle of the cycle. This means that the cell did not appear.
- In the second part the temperature is almost at the same level as in the first. This shows the absence of progesterone produced after the cell exits.
If the line is in the same plane all the time, ovulation has not occurred. Without it, fertilization is impossible, and therefore it is necessary to visit a doctor, observing such a picture for the second time. There is no need to delay in order to receive treatment in a timely manner.

Basal temperature charts during pregnancy (examples)
What does the graph show during pregnancy?
Charts of basal temperature during pregnancy, examples of which can be considered below, are somewhat different, because conception occurs, which cannot but affect the indicators. The changes on the graph are shown as follows:
- The first phase occurs similarly to the previous cycles.
- After a sharp jump (ovulation), a rise in temperature is observed, which lasts more than 14 days. The absence of a decline 3-5 days before the expected menstruation clearly indicates a new condition.
- A confirmation of the girl’s condition is the implantation sinking by 0.2-0.3°C. It occurs approximately 7 days after the cell is released and lasts 1-2 days. Afterwards the line returns to higher values.
Implantation decline is not noticeable in every girl, and therefore maintaining a constant elevated temperature is considered a more relevant confirmation of pregnancy. It remains at this level after the delay and lasts until childbirth.
 If a woman is pregnant, then the elevated temperature after the day of ovulation will persist until childbirth, as in the example graph.
 Examples of graphs for hormone deficiency
By looking at basal temperature charts with examples, you can identify many deviations, each of which can pose a threat to health or indicate the need for treatment.
The normal progression of processes is influenced by hormones typical for each stage of the cycle. When they are imbalanced, temperature deviations are also observed. Thus, the lack of estrogen that accompanies cell maturation is expressed as follows:
- The line in the first part stays above 36.5°C.
- After ovulation, the rise takes over 3 days.
- In the second part, the values are higher than normal – from 37.1°C.
In this state of affairs, fertilization is quite problematic.

Corpus luteum deficiency
Insufficiency of the corpus luteum, which produces progesterone necessary to maintain fertilization and pregnancy, is detected as follows:
- The temperature rises slowly after ovulation.
- Before menstruation there is an increase, not a decrease.
- The second period is less than 12-14 days.

Estrogen-progesterone deficiency

In any of the described cases of imbalance, a visit to a specialist is necessary. After testing for hormones, the doctor prescribes their substitutes. The intake should be carried out strictly according to the prescribed course and should not be canceled independently if pregnancy is suspected. Abrupt withdrawal of the drug can cause fetal rejection.
For the first cycle, clostilbegit is often prescribed, for the second - utrozhestan or duphaston. Using stimulant medications, the girl is more likely to notice the return of the schedule to normal: two phases with a temperature difference of 0.4-0.6 ° C and with obvious ovulation at their border.
If the schedule remains non-standard, with elevated readings, you need to inform your doctor. Probably, the selected dose is not suitable and you need to change the course.
Hyperprolactinemia - graph indicators
Separately, it is worth noting the atypical schedule with elevated prolactin levels. More often this situation is typical for breastfeeding women. They show the same indicators as pregnant women. The basal temperature chart during pregnancy, examples of which we have examined, is characterized by constantly high levels and the absence of menstruation.
This condition is called hyperprolactinemia. If this is a nursing mother, then there is nothing to worry about. After the allotted time, the prolactin level will decrease and the cycle will return to normal. If this is observed in a nulliparous girl, you need to visit a doctor and identify the reason for such hormone levels.
 An example of a graph of basal temperature during pregnancy indicating hyperprolactinemia
 Examples of graphs showing diseases
The graph, in addition to ovulation and the normal passage of the cycle, can also reveal some diseases.
Inflammation of the appendages is characterized by an increase for several days to 37°C in the first period, after which there is a decline before ovulation. The jump occurs very sharply, most often on days 6-7, and after several days there is an equally sharp decline. Sometimes such growth is mistaken for ovulation. A visit to the doctor is necessary because... With untreated inflammatory processes, the normal course of pregnancy is problematic.
Endometritis on the example of a graph
Endometritis can be identified by comparing the end of one cycle and the beginning of the next.

Rules for measuring basal temperature (video)
The video describes the most popular rules for measuring basal temperature; these are the basic recommendations, if followed, you can be sure of the correct measurement.
conclusions
- If an unusual rise or fall is noticed for one day, there is no need to worry. Any deviation cannot occur as an isolated incident. Here, it is more likely that there is a violation of the measurement rules or the influence of external factors (lack of sleep, stress, colds).
- If the readings are higher or lower than normal, but the difference between the phases is at least 0.4°C, this is a normal cycle. Simply due to the characteristics of the body, the girl’s indicators do not meet the standard.
- If you observe the same atypical picture for more than two cycles, you need to visit a doctor. Despite the availability of graphs, he will make a diagnosis only after testing.
- Infertility is suspected: retraction of the line in the second period, in the middle the rise is observed for more than 3 days, the difference between the average values of the phases is less than 0.4°C.
- Graphs showing the absence of cell release, cycle duration less than 21 days, length of the second phase less than 10 days, menstruation more than 5 days, delays, late ovulation should be the basis for contacting a doctor.
- If, with normal ovulation and sexual intercourse on these days, conception does not occur for more than 2-3 months, you need to undergo an examination to identify the cause.
- If there is a delay, high values over 18 days, but a negative test, you need to urgently visit a doctor. It is possible to develop an ectopic pregnancy.
These are the conclusions for girls planning to conceive or already pregnant, who have kept or are keeping basal temperature charts, are common in the field of gynecology and are recommended by specialists
Most women have heard about such a concept as “basal temperature” more than once, but few understand what this medical term means, why it is necessary to monitor this indicator and how to decipher the BT schedule of a pregnant and non-pregnant woman. We'll help you figure it out.
Basal temperature - what is it?
Basal body temperature is the minimum indicator that is observed after prolonged sleep and rest. Various processes in a woman’s body increase BT indicators, it is thanks to this feature that changes in hormonal levels can be determined during Deviations in indicators are a signal of certain disturbances in the functioning of systems and organs. For example, pregnant women are often monitored. BT charts with low temperature in phase 2 may indicate a threat of miscarriage. And such indicators in a non-pregnant woman indicate infertility.
Why is basal temperature determined?
By analyzing changes in BT, the following pathologies are determined:
- The presence or absence of ovulation.
- The information obtained can be used both for pregnancy planning and for the calendar method of contraception.
- Cycle disorders. If there is a deviation from the norm, the doctor may suspect certain diseases of the reproductive system, such as the presence of an inflammatory process or luteinizing phase deficiency, as well as hormonal disorders.
- Using BT indicators you can find out about early pregnancy. The BT schedule for a pregnant woman has its own characteristics, which are described in more detail below.
How to measure BT?
How to measure basal body temperature? To do this, you need to stock up on a separate thermometer, preferably a mercury one. BT is measured in the mouth, vaginally and rectally. The latter method is considered the most preferable, since the results of such measurements are the most reliable due to the minimal influence of external factors. BT is not measured in the armpit. You only need to choose one method, without changing it throughout the entire diagnostic period, which is at least 3 months. Measurements should be taken in the morning, after at least 6 hours of sleep, without getting out of bed, preferably at the same time.
Women with menstrual irregularities and pregnant women monitor changes in basal temperature. BT charts for planning girls will become indispensable assistants in determining favorable days
You need to start recording BT indicators on the first day of menstruation (the beginning of the cycle) in order to obtain complete information for the monthly period. Pregnant women should maintain BT schedules regularly throughout the first trimester.
It is recommended to record the results immediately after the measurement, since an error may affect the diagnosis and decoding of the indicators. In addition to indicating the temperature itself, it is necessary to indicate the day of the cycle, the number of days of menstruation. It is extremely important to note additional factors that may affect measurement results: taking medications, lack of sleep, illness, stress, physical activity, sexual intercourse on the eve of measurements, consumption of spicy foods and alcohol. The BT schedule for a pregnant woman, in addition to the above factors, should reflect the woman’s well-being and sensations.
Maintaining BT records
You can record data in a notepad, but it is more convenient to use online applications or computer programs to record and analyze measurements of basal body temperature. This will decipher the BT chart of a pregnant and non-pregnant woman: determine ovulation, calculate the average temperature of each phase of the cycle, highlight deviations from the norm, and give recommendations. But do not forget that the resulting software transcript is only preliminary generalized data that cannot be a diagnosis or a guide to self-medication. The recorded results must be shown to the attending gynecologist. Pregnant women should pay special attention to the results obtained. BT charts with low temperatures should be shown to your doctor.

Changes in BT throughout the menstrual cycle
In order to understand the principle on which the diagnostic method using basal temperature is based, it is important to understand what processes in a woman’s body are associated with changes in temperature indicators.
The monthly menstrual cycle in medicine is usually divided into 4 phases:
- Menstrual - begins from the first day of menstrual flow. This day is also considered the first day of a woman’s monthly cycle. During this period, the body rejects the endometrium and prepares at the hormonal level for the development of a new egg. This phase lasts up to 7 days. BT during this period should normally correspond to 36.2-36.6 degrees.
- This is followed by the follicular phase. During this period, the body intensively produces which contributes to the development of follicles, and subsequently - eggs. This period of the menstrual cycle lasts up to two weeks. The basal temperature during the follicular phase rises slightly and is normally 36.7-36.9 degrees. Within a day or two, a preovulatory temperature drop occurs - up to 36.3 degrees.
- The ovulatory phase lasts about 3 days. This period is characterized by a decrease in the production of follicle-stimulating hormone and an increase in the level of luteinizing hormone. Thanks to the latter, the egg is released from the follicle - this process is called ovulation. This is the most favorable time to conceive a baby. Basal temperature during the period of ovulation increases and reaches values of up to 37.7-37.9 degrees.
- The last phase, luteinizing, is characterized by intensive production of progesterone to maintain pregnancy if it occurs. The basal temperature in this phase remains above 37 degrees. In the absence of fertilization of the egg, temperature indicators sharply decrease 1-2 days before the expected menstruation and amount to 36.6-36.8 degrees. After this, a new cycle begins.
The BT chart of a pregnant woman (after conception) should normally look like a monotonic straight line with BT values above 37 o C.
Standards for BT indicators
With basal temperature indicators that correspond to established standards, at the end of the monthly cycle the curve of the resulting graph will have a clearly defined two-phase separation. So, in the first half of the cycle the line will pass below 36.8. A few days before ovulation, a pre-ovulatory decrease in temperature will be noted, after which there will be a sharp increase in indicators of at least 0.4 degrees. The jump is divided by a red line - this indicates the day of ovulation. After this, the elevated temperature lasts up to 14 days, then a premenstrual drop in the indicator is recorded.

BT during pregnancy: normal
If within 16 days after ovulation the thermometer shows more than 37 degrees, this may indicate pregnancy. If conception occurs, the egg attaches to the wall of the uterus. Progesterone and the “pregnancy hormone” - hCG - begin to be produced. When women are pregnant, BT charts show a temperature of 37-37.6 o C. In 25% of cases, in the early stages of embryo development, an increase to 38 o C is observed. In addition, with normal progesterone production, there will be no premenstrual drop in basal temperature.
Once conception is confirmed, doctors recommend continuing to maintain the schedule throughout the first trimester. It is especially important to maintain a BT schedule for a pregnant woman who has had a history of miscarriages or early fetal death. At later stages, such a procedure turns out to be uninformative due to changes in hormonal levels.
On websites for expectant mothers and forums, you can view the so-called “pregnant” BT charts. A photo showing normal indicators during the menstrual cycle, accompanied by conception, is presented below.
Implantation retraction - what is it?
Often there are “pregnant” BT schedules with implantation retraction - a sharp decrease in temperature approximately 5-7 days after ovulation. The next day the readings return to above 37 degrees. This temperature change is observed during the period when the fertilized egg attaches to the wall of the uterus. Fixation on the chart is considered a sign of pregnancy. In addition to a sharp jump in temperature, slight spotting from the genitals and a pulling sensation in the lower abdomen may sometimes be observed. But if, simultaneously with such symptoms, a woman observes “pregnant” schedules with low BT, this is a serious reason for urgently seeking medical help - there may be a threat of miscarriage.

BT during pregnancy: deviations
Deviations from established norms for basal temperature indicators often indicate various disorders, sometimes dangerous conditions of the pregnant woman and baby. If you have followed all the measurement rules, and the thermometer records readings below 37 or above 38 degrees, you need urgent consultation with a specialist. You need to pay attention to your health status in the following situations:
- In previous cycles, the basal temperature in the postovulation period was 37-37.3 o C, and during pregnancy it jumped sharply to 38. Such a change in indicators may indicate the presence of various types of inflammatory processes in the body. It is necessary to undergo a series of tests and diagnostic procedures to make a correct diagnosis. But if before pregnancy the temperature in the second half of the cycle was close to 38, there is no cause for concern; in this case, high BT levels are individual characteristics of the body.
- “Pregnant” BT schedules with low temperature in phase 2 require urgent medical attention. Indicators below 37 degrees indicate a lack of progesterone - this is extremely dangerous during pregnancy. A decrease in hormone levels can threaten spontaneous termination of pregnancy (miscarriage). With timely diagnosis of the pathological condition, it is possible to normalize progesterone levels by taking synthetic drugs. In this case, there is a high probability of preservation and further normal development of pregnancy. Another reason for a decrease in temperature can be a frozen pregnancy. Unfortunately, in this case it is not possible to save the fetus. This diagnosis must be confirmed using ultrasound diagnostics. If pregnancy fading is confirmed, the doctor will prescribe curettage of the uterine cavity for medical reasons.

Norm and deviations of the basal temperature curve
We discussed above what BT indicators should normally be at a certain period of the menstrual cycle. Now let's figure out what types of graphs there are that indicate deviations in health:
- If in the second half of the cycle the basal temperature rises only slightly (up to 0.3 degrees) and such curves are recorded for several cycles in a row, the doctor may suspect a hormonal imbalance: a possible lack of progesterone. Such deviations lead to a lack of ovulation and, consequently, to infertility.
- In most cases, women whose basal temperature rises only a few days before menstruation, and the duration of the second half of the cycle is 10 days or less, encounter problems when bearing a child. In addition, there is no decrease in temperature before the onset of menstruation. In such a situation, doctors talk about the insufficiency of the second phase of the cycle, the threat of pregnancy failure. Timely detection of pathology is corrected with medications.
- A graph curve that does not have a pronounced decrease or increase in temperature, and based on the results of the indicators it is not possible to divide the cycle into separate phases, indicates the absence of ovulation. This cycle is called “anovulatory”. During the course of a year, a woman can normally have 1 cycle without ovulation. But if such a schedule is fixed for three months or more, you need to contact a gynecologist for examination. With such basal temperature indicators, pregnancy is impossible. An example of such a graph is clearly presented below.
- A zigzag, chaotic curve of the basal temperature graph indicates a lack of estrogen in a woman’s body. This leads to a lack of development of follicles, and subsequently the egg. And as a result - anovulation and infertility. Be sure to seek the advice of a specialist if these types of charts persist for more than three cycles in a row.

Measuring basal temperature is an effective and affordable home method for diagnosing various pathologies in a woman’s body. The BT schedule of a pregnant woman is extremely important - timely identification of the problem can save the life of the unborn baby and mother. But do not self-medicate - if your temperature deviates from the norm, consult a gynecologist.
Ovulation is a key event in a woman's menstrual cycle. If you accurately determine the day when it occurs, it is possible not only to plan conception, but also to slightly influence the gender of the unborn baby.
Various methods can be used to obtain information about when the egg leaves the ovary: ultrasound of the ovaries or determination of the concentration of sex hormones several times during the cycle. But the simplest and free method that every woman can carry out at home was and remains basal thermometry. A careful analysis of how basal temperature changes daily will make it possible to study the functioning of the ovaries, understand whether ovulation is occurring or not, and determine pregnancy earlier than a test can show it.
The essence of the basal thermometry method
A key role in controlling the female body is played by sex hormones: progesterone and estrogen, prolactin, gonadotropic hormones of the hypothalamus and pituitary gland. The balance between them is reflected in many processes, including body temperature, which is called basal.
Basal temperature is the lowest temperature indicator, indicating the actual temperature of the internal organs. It is determined immediately after rest (usually after a night’s sleep), before the start of any physical activity that will create measurement error. Only departments that communicate with body cavities are suitable for its establishment. These are the vagina (it is connected to the uterus), the rectum (it is directly connected to the large intestine) and the oral cavity, which passes into the oropharynx.
The hormones estrogen and progesterone set the basal level. They “dictate” what basal temperature a particular woman should have during ovulation.
A normal amount of estrogen by itself does not affect the temperature. The task of this hormone is to prevent progesterone from affecting the thermoregulatory center located in the hypothalamus (this is an area associated with the brain).
In the first half of the cycle, estrogen “dominates”. It does not allow the basal temperature to rise above 37°C. During the period of ovulation, when initially an increased amount of estrogen enters the blood, there is a decrease in temperature by about 0.3°C. When the egg leaves the follicle, and in its place a corpus luteum appears, producing progesterone, the thermometer shows 37°C or more. In this case, the basal thermometry graph becomes similar to a bird with open wings, whose beak symbolizes the day of ovulation.
Further, when the corpus luteum dies (if conception has not occurred) and the amount of progesterone decreases, the temperature drops. During menstruation, the indicator stays at 37°C, then decreases and everything repeats all over again.
If pregnancy occurs, more and more progesterone is produced normally, so the temperature does not decrease as before menstruation, but, on the contrary, increases.
What determines the day of ovulation
Knowing on what day the oocyte leaves the follicle, a woman can:
- plan a pregnancy: after 3-4 months of charting, you can practice sexual intercourse not “approximately”, counting 14 days from the expected start of the next menstruation, but knowing exactly the day of ovulation;
- plan the gender of the unborn baby (the method is not 100%). If you want a boy to be born, then it is better to plan sexual intercourse on the day of ovulation (on this day the basal temperature decreases and vaginal leucorrhoea takes on the color and consistency of raw chicken protein). If your dream is to give birth to a girl, it is better to have sex 2-3 days before expected ovulation;
- knowing when ovulation occurs, you can, on the contrary, avoid conception, since a few days before it, the very day the egg is released and the day after are the most “dangerous” days;
- the graph will show if there are hormonal problems, inflammation of the reproductive organs or lack of ovulation (), which is why conception does not occur.
In addition, drawing a basal thermometry graph in some cases will allow you to determine pregnancy without purchasing a test. And if you continue to manage it the first time after conception, you can see the threat of miscarriage in time and take the necessary measures.
How to properly perform basal thermometry
It is very important to know how to correctly measure basal temperature to determine ovulation. After all, a woman’s body is extremely sensitive to minimal changes in external conditions, and the units of measurement in which the graph is kept are tenths of a degree (this is where a fluctuation of 0.1-0.05°C can be important).
Here are the basic rules, if followed, the temperature graph will become as informative as possible:
- Measurements are taken either in the rectum (optimally), or vaginally, or in the mouth (for this you need a special thermometer).
- The thermometer needs to be inserted 2-3 cm and lie quietly while taking measurements for 5 minutes.
- Before taking measurements, you cannot sit down, spin around, stand up, walk, or eat. Even shaking the thermometer can lead to a false result.
- Choose a high-quality thermometer (preferably mercury) with which you will measure your temperature daily for 3-4 months.
- Place on a table (shelf) near the bed, which you can reach in the morning without getting up, 3 things: a thermometer, a notebook and a pen. Even if you start keeping your schedule on a computer - in online or offline programs, it is best, after reading the thermometer readings, to immediately write it down indicating the number.
- Take measurements every morning at the same time. Plus or minus 30 minutes.
- Before taking measurements, be sure to sleep for at least 6 hours. If you got up at night, take measurements later so that 6 hours have passed.
- Thermometry should be taken at 5-7 am, even if you can sleep until noon. This is explained by the daily biorhythms of the hormones of the adrenal glands and hypothalamus, which affect the basal temperature.
- The accuracy of measurements is affected by travel, alcohol consumption, physical activity, and sexual intercourse. Therefore, try to avoid these situations as much as possible during basal thermometry, but if they happen, mark them in the chart. And if you get sick and develop a fever, all measurements for the next 2 weeks will be completely uninformative.
When should you start measuring your basal temperature?
From the very first day of menstruation, that is, from the first day of the cycle.
How to keep a schedule?
You can do this on squared paper by drawing 2 lines: on the horizontal line (along the abscissa axis) mark the day of the month, and draw the vertical line (ordinate axis) so that each cell represents 0.1°C. Every morning, place a dot at the intersection of the thermometry reading and the desired date, and connect the dots. There is no need to take your temperature in the evening. Below the horizontal line, leave a place where you will write daily notes about the discharge and events that happened that could affect the indicators. Draw a horizontal line over the measurement results, starting from day 6 to day 12. It is called overlapping and serves for the convenience of deciphering the graph by the gynecologist.
We also suggest using a ready-made template for the basal temperature graph below, saving it to your computer and printing it out. To do this, move the cursor over the image and use the right-click menu to save the image.

Note! If you are taking birth control, you do not need to take thermometry. These drugs specifically disable ovulation, which makes them contraceptive.
Read also about other methods for determining ovulation in ours.
What does the basal temperature graph look like during ovulation (that is, during a normal ovulatory cycle):
- in the first three days of menstruation, the temperature is about 37°C;
- by the end of menstruation, temperature indicators drop, amounting to 36.4-36.6°C;
- then, within 1-1.5 weeks (depending on the length of the cycle), thermometry shows the same numbers - 36.4-36.6 ° C (can be lower or higher, depending on the metabolic processes in the body). It should not be the same every day, but fluctuate a little (that is, not a straight line is drawn, but zigzags). After 6 values connected by an overlapping line, there must be three days when the temperature is 0.1°C or more, and on one of these days it is higher than 0.2°C. Then after 1-2 days you can expect ovulation;
- just before ovulation, the thermometer shows the basal temperature 0.5-0.6°C lower, after which it rises sharply;
- during ovulation, the basal temperature is in the range of 36.4-37°C (according to other sources, above 37°C). It should be 0.25-0.5 (on average 0.3°C) higher than at the beginning of the menstrual cycle;
- what the basal temperature should be after ovulation depends on whether conception has occurred or not. If pregnancy does not occur, the numbers gradually decrease, by a total of about 0.3°C. The highest temperature is observed on days 8-9 after the release of a mature oocyte. It is on this day that the fertilized oocyte is implanted into the inner uterine lining.
Between the average numbers of the two halves of the cycle - before and after ovulation - the temperature difference should be 0.4-0.8 ° C.

How long does basal temperature last after ovulation?
Before the onset of menstruation. Usually this is 14-16 days. If 16-17 days have already passed, and the temperature is still above 37°C, this most likely indicates pregnancy. During this period, you can do a test (the main thing is that 10-12 days have already passed after ovulation), you can determine hCG in the blood. Ultrasound and examination by a gynecologist are still uninformative.
These are indicators of the normal basal temperature during ovulation, as well as before and after it. But the menstrual cycle does not always look so perfect. Usually the numbers and type of curve raise many questions among women.
High numbers in the first phase of the cycle
If after menstruation the basal thermometry numbers are above 37°C, this indicates an insufficient amount of estrogen in the blood. In this case, an anovulatory cycle is usually observed. And if you subtract 14 days from the next menstruation, that is, look at phase 2 (otherwise it is not visualized), then you can see sharp jumps in temperature indicators, without their gradual increase.

The syndrome is accompanied by various unpleasant symptoms: hot flashes, headaches, heart rhythm disturbances, and increased sweating. This type of temperature curve, together with the determination of low levels of estrogen in the blood, requires the doctor to prescribe drugs - synthetic estrogens.
Progesterone and estrogen-progesterone deficiency
If after ovulation the basal temperature does not rise, this indicates progesterone deficiency. This situation is a common cause of endocrine infertility. And if conception does occur, then there is a danger of miscarriage in the early stages, until the placenta forms and takes over the function of producing progesterone.

Insufficient functioning of the corpus luteum (the gland formed at the site of the opened follicle) is indicated by a decrease in temperature indicators already 2-10 days after ovulation. If the length of phase 1 of the cycle can still vary, then the second phase should be the same and average 14 days.
Progesterone deficiency can be assumed if the numbers increase to just 0.3°C.
If you already have a low basal temperature 2-3 cycles after ovulation, contact your gynecologist with this chart. He will tell you on which days of the cycle you need to donate blood to determine progesterone and other hormones in it, and based on this analysis he will prescribe treatment. Usually, the administration of synthetic progesterones is effective, and as a result, the woman is able to become pregnant and carry a child to term.
Estrogen-progesterone deficiency

This condition, when the ovaries do not produce sufficient quantities of both hormones, is indicated by a temperature graph that does not have significant fluctuations (there are large areas with straight lines rather than zigzags). This condition is also indicated by an increase in temperature to only 0.3°C after ovulation.
Anovulatory cycle
If it is already the 16th day of the menstrual cycle, and there is no characteristic decrease and then increase in temperature, most likely there was no ovulation. The older a woman is, the more such cycles she has.

Based on the above, basal thermometry is a simple and inexpensive method for determining the optimal days for conception, as well as the reasons why pregnancy may not occur. It only requires 5-10 minutes of time in the morning. Whatever indicators you see in yourself, this is not a reason for panic or self-medication. Contact your gynecologist with your schedule several cycles in advance, and you will be prescribed a diagnosis and treatment.